
Excel is one of the most powerful tools when it comes to data analysis and representing the analyzed data in the form of charts and graphs. If you are an analyst, you know well how much time is spent in creating a graphical visualization of data and it is time-consuming, right? In this era of automation, there is no scope for manual processing. So here we are with a new blog on automating the process of creating charts and graphs in excel. We will see how we can use VBA to automate this process.
We will also look into the different aspects of the charting engine provided by Microsoft Excel.
Basically, we have two types of the charts which can be manipulated for VBA:
- Chart Sheet
- Embedded Chart
Chart Sheet
Chart Sheets are separate sheet tabs in your workbook.
Dim chtChart As Chart
Set ChartDemo = Application.Workbooks(“Chart Demo.xlsm”)
Set DataSheet = ChartDemo.Sheets(“Data”)
‘Check if the chart sheet already exist with the same name
IfChartExist chartname:=”Sales”
Set chtChart = Charts.AddWith chtChart
.name = “Sales”
.ChartType = xlColumnClustered
‘Specifying the data source
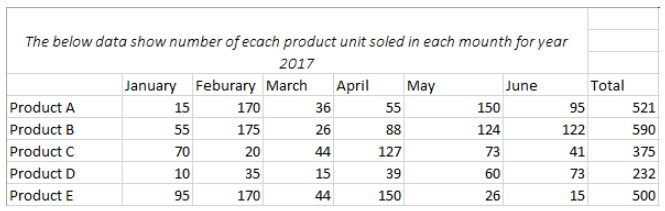
.SetSourceData Source:=DataSheet.Range(“A4:G9”), _
PlotBy:=xlRows
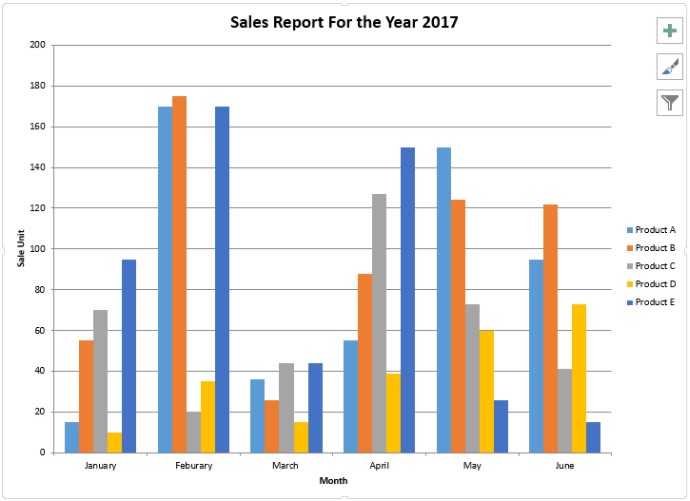
.HasTitle = True
.ChartTitle.Text = “Sales Report For the Year 2017”
.Axes(xlCategory, xlPrimary).HasTitle = True
.Axes(xlCategory, xlPrimary).AxisTitle.Characters.Text = “Month”
.Axes(xlValue, xlPrimary).HasTitle = True
.Axes(xlValue, xlPrimary).AxisTitle.Characters.Text = “Sale Unit”
End WithEnd Sub
Let’s dive into the code and see what’s exactly going on.
The first line states how to start the procedure in VBA. We are creating a procedure as ChartSheetDemo, which will contain our chart creation logic.
The below lines are declaration and initialization of variables we will be using.
We have declared a Chart type variable.
The ChatDemo is an object type variable which corresponds to our workbook. ChartDemo variable now contains all the attributes and property of the current workbook and we can use this variable to manipulate workbook properties and attributes. We will also need this variable to access different sheets in this workbook.
DataSheet contains the data from which we have generated our chart. It is also of type object. DataSheet has a public access specifier.
Before we add the chart sheet to the workbook, we should check if we already have a chart with the same name otherwise it will throw an error. So, below the line is a validation check. IfChartExist is a parameterized procedure which takes chart sheet name as an argument. The mechanism which is used here to pass the argument is known as a named argument.
This line will add the chart to the workbook.
Now we will be settings different properties of our chart. You can play around with these properties to check out their functioning.
.name = “Sales” Sets the tab name of the chart sheet.
.ChartType = xlColumnClustered Tell the type of chart sheet.
‘Link to the source data range
.SetSourceData Source:=DataSheet.Range(“A4:G9”), _
PlotBy:=xlRows
The above line specifies the data source which will be referred by the chart to generate the bar chart.
.ChartTitle.Text = “Sales Report For the Year 2017”
.Axes(xlCategory, xlPrimary).HasTitle = True
.Axes(xlCategory, xlPrimary).AxisTitle.Characters.Text = “Month”
.Axes(xlValue, xlPrimary).HasTitle = True
.Axes(xlValue, xlPrimary).AxisTitle.Characters.Text = “Sale Unit”
End With
In the next blog, we will see how to create an embedded chart using VBA. Also, there are lots of new topics coming on Excel VBA Automation so stay tuned.
Thank you, all the readers will see you in the next blog. Till then keep reading.
Ignatiuz is having a strong expertise to provide better solution for Learning Management System (LMS) Solution as per the client requirements. To know more about the providing please visit http://ignatiuz.com/solutions/lms-solutions
If you have any query or want more information on Excel Automation or Excel VBA Coding, contact us today at +1-484-876-1867 or send us a message.


[…] So my friends this blog is in continuation of my previous blog – Excel VBA working with charts – Part 1 […]
[…] my friends this blog is in continuation of my previous blog – Excel VBA working with charts – Part 1 if you haven’t read it follow the link. In part 1 we looked on creating chart sheet in this […]