Working With JMeter
In my previous blog, I have explained What is What is JMeter?? Now let’s move forward to one level up and see how to work with JMeter.
-
- How to Download JMeter?
Download JMeter from the link given below:-
http://jmeter.apache.org/download_jmeter.cgi-
- Download and install either the latest JRE or JDK. JMeter is totally based on Java application so it’s necessary to have Java on the system as a prerequisite.
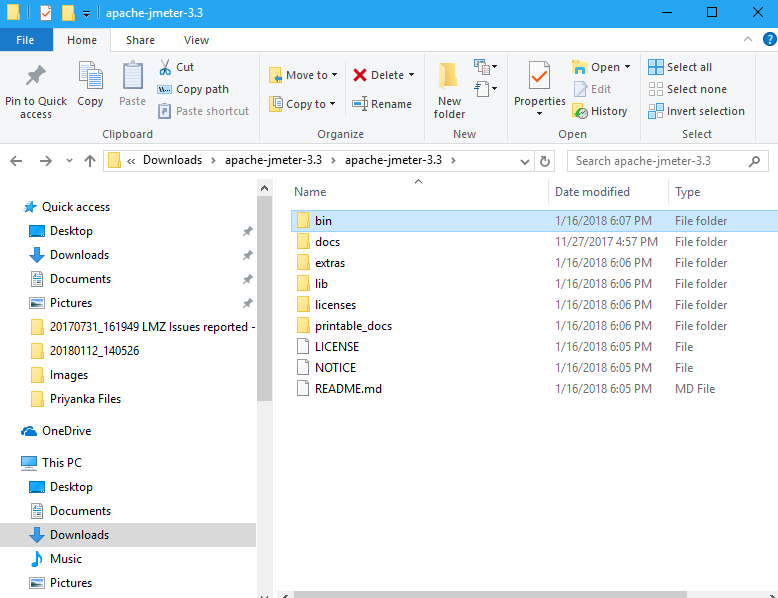
- Go to Apache JMeter and search for Binary to download, just check once that the downloaded file is always the latest version of JMeter….
- Extract the folder and place the folder in the desired location.
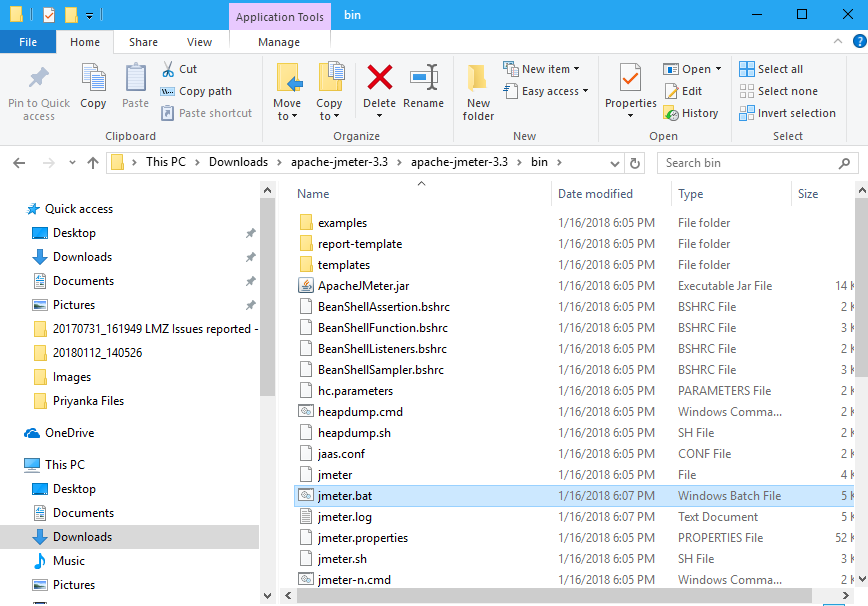
- Open extracted JMeter folder and search for the .bat file in your folder.C:\Users\Downloads\apache-jmeter-3.3\apache-jmeter-3.3 \bin\jmeter.bat


-
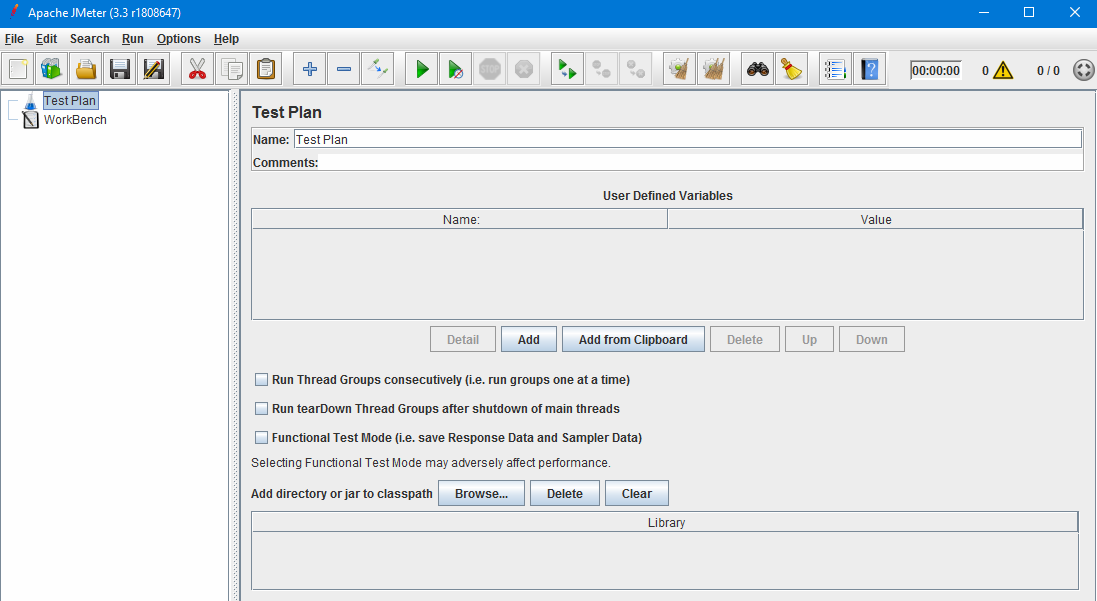
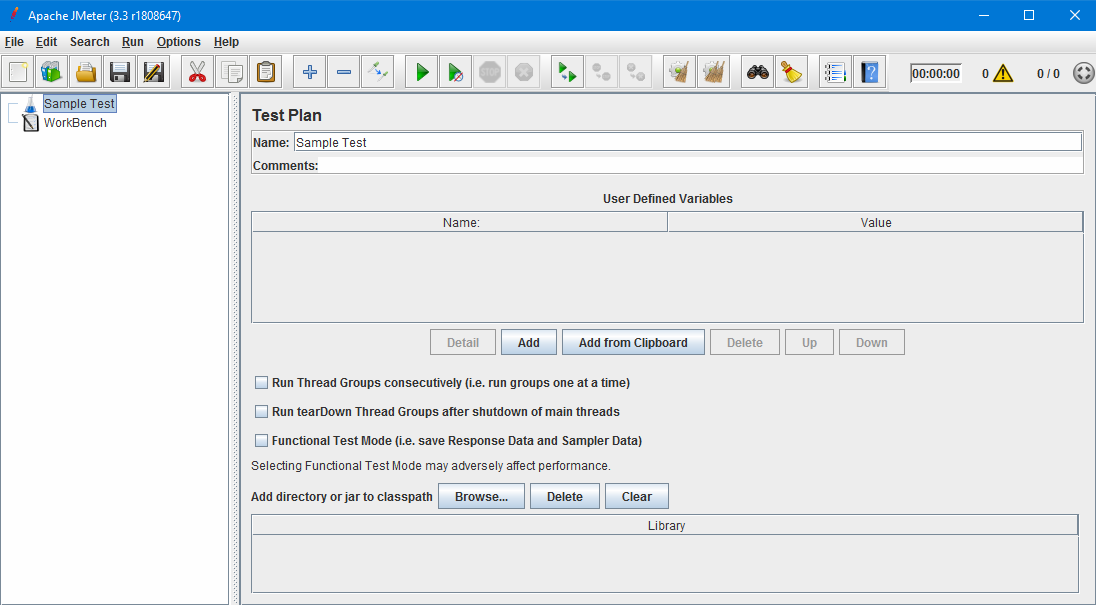
- The JMeter window will appear.
-
- How to create a Test plan?As the JMeter window appears, one can see the hierarchy of a default test plan present in the left panel of JMeter window.
Rename the Test plan. You can change the name of the test plan through the Name: textbox. to see the reflection of the name, just click on the workbench and go back to the new name of the test plan, and you can see the reflection as below.
- How to create Thread Group?
- Thread group is a part of the test plan that needs to be added to the created test plan.
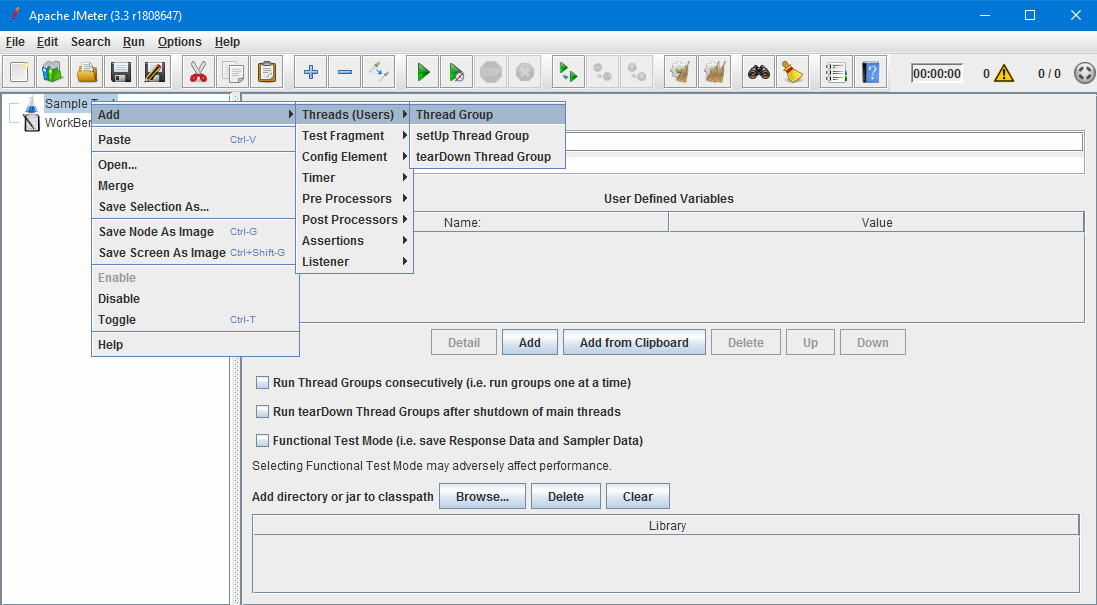
- The main element of the test plan is the Thread Group, which contains all the samplers, listeners and controllers.Here in JMeter, all the element nodes are added by right-clicking on the desired node.
Steps:-
- Right-click on the Sample Test (our Test Plan) now navigate to >
- Add >
- Threads (Users) >
- Click on Thread Group option.
The Thread Group, gets added to the Test Plan (Sample Test) node.
- We can also change the name of the Thread Group according to the project for which we are creating the Performance report.
- How to add Request sampler?
- Samplers help JMeter to send the request to the server and wait for the response. They are executed in the same manner as they are added to the hierarchy.
- To Add Request Sampler under Thread Group:- Steps:-
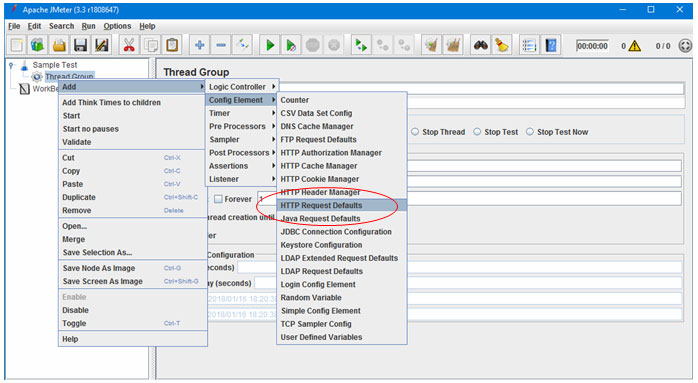
- Right click on thread group in the left panel and go to ADD >
- Config Element >
- HTTP Request Defaults >
Here “HTTP Request Defaults” sampler gets added.
- After the “HTTP Request Defaults“ has been added.
- Now, under the Web Server section, add the domain name and path.
- Go to “Server Name or IP:” and enter the domain name.
- Go to “Path:” and enter backslashThe backslash describes the root pages on the server, it also decides that the pages that are sent, are the default pages of the site or not.
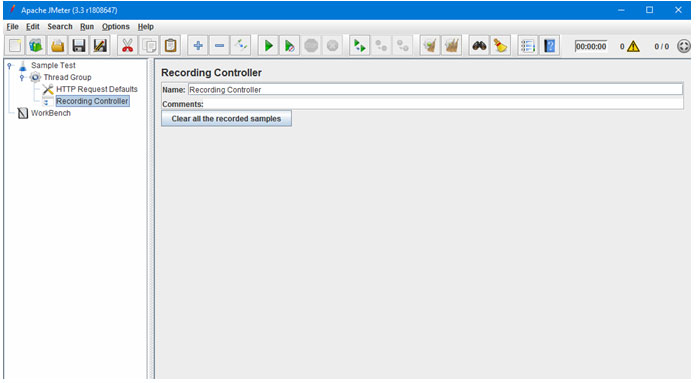
- How to add recording controller?
- As the test plan has been added, now add a recording controller in the thread group.
- Recording controller helps to record the website navigation steps easily, that can be used for load testing purpose.
- To add recording controller follow below steps :-
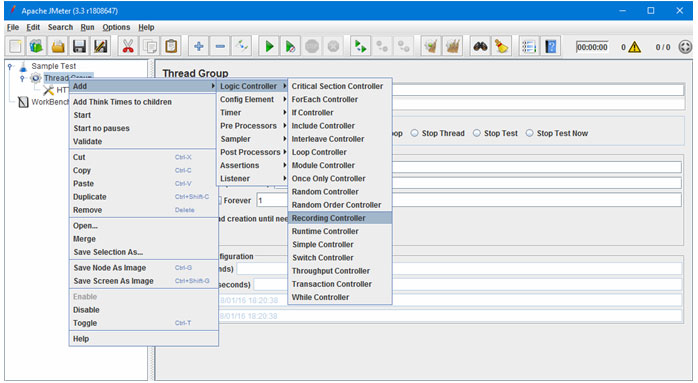
Steps :-- Right click on thread group in the left panel and go to ADD >
- Select Logic Controller >
- Click on Recording Controller >
- The recording controller is a placeholder where the proxy server can save all the recorded requests.
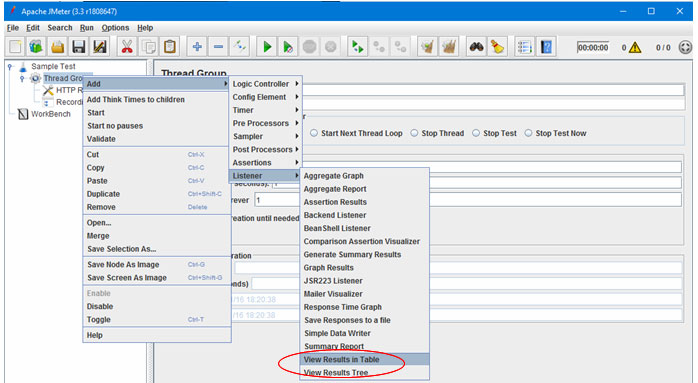
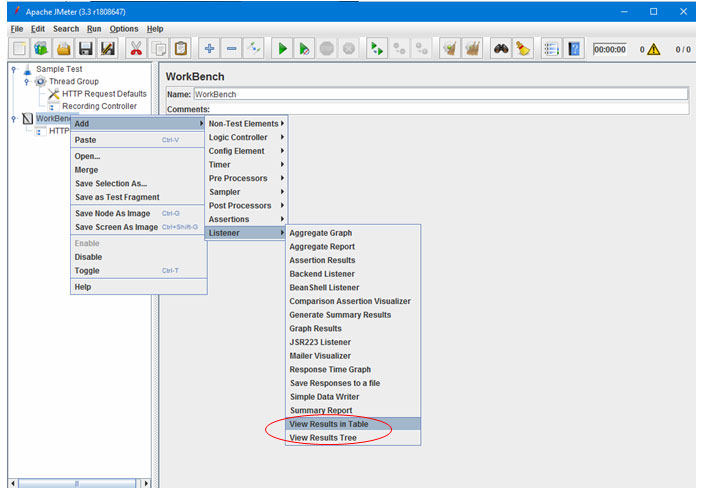
- How to add Listeners?
- Listeners are mainly added to see the result of all the recorded script in a single report.
- As “View result in table” is added, one can use other listeners such as an Aggregate graph, Summary report etc. whichever suits your test case.
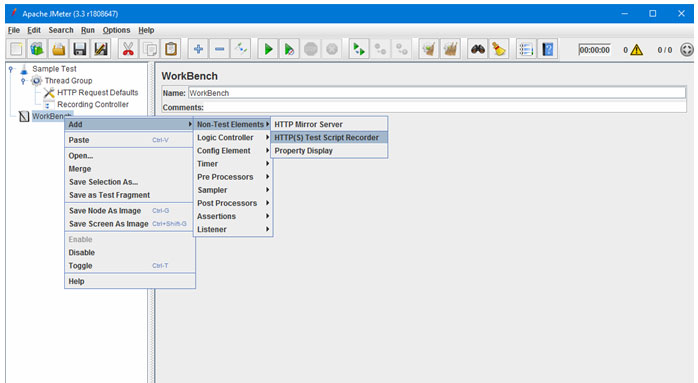
- How to add HTTP(s) Test Script Recorder?
- All the recorded proxy server requests are placed under HTTP proxy server, which comes under Workbench and in JMeter’s new version, the HTTP Proxy server is replaced by the name HTTP(s) Test Script Recorder.Note: – The items added under workbench does not get saved, if you want to save the record, right-click on Workbench, and select the option Save Selection As….and the workbench gets saved to the desired location.
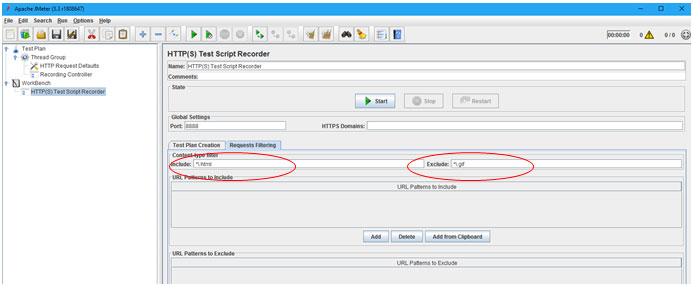
- In the HTTP(S) Test Script page you need to make some changes as:-
- Change the port no. as 8080 so that we serve only single port for JMeter.
- Change the port no. as 8080 so that we serve only single port for JMeter.
- If needed change “Request filtering” setting. Here we can add URL pattern which are written in regular expressions below:-
-
- URL pattern to include by using (.*).
- URL pattern to Exclude (*.gif), (*.png)
This can be useful to include the type of request you want to include in recording (e.g. *.html, *.php, etc) and exclude the type of URL pattern request (e.g. *.jpg, *.png, *.js,*.gif etc).
- Target Controller specifies where the recorded script will be added.
-
- Now add a listener again under HTTP (S) Test Script Recorder to see the complete recorded report.
- All the recorded proxy server requests are placed under HTTP proxy server, which comes under Workbench and in JMeter’s new version, the HTTP Proxy server is replaced by the name HTTP(s) Test Script Recorder.Note: – The items added under workbench does not get saved, if you want to save the record, right-click on Workbench, and select the option Save Selection As….and the workbench gets saved to the desired location.
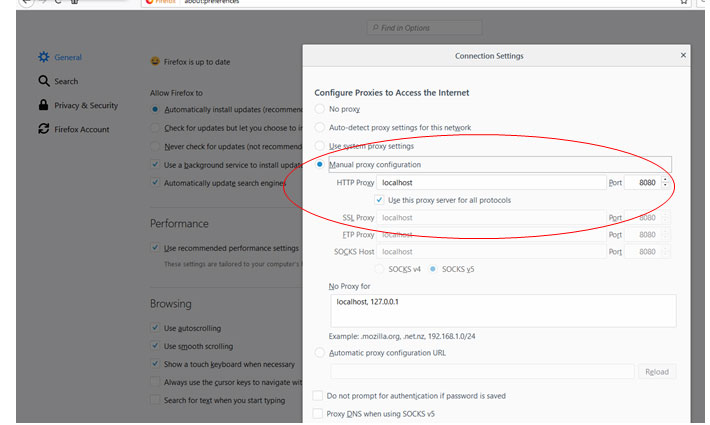
- How to set proxy setting in browser ?
- As all the elements of the recording script are set, we just need to make minor changes in the browser.
-
- Open Firefox
- Go to Options
- Under that advance setting
- Select Network option
- In network, go to connection, click on setting and change the setting as mentioned below.
- Select “Manual proxy configuration”
- Enter localhost in “HTTP Proxy” box.
- Change the Port to “8080” for all types of proxy.
Now, finally, after adding all the elements and performing all the necessary changes, we can start recording the script according to our test scenario.
-
- As all the elements of the recording script are set, we just need to make minor changes in the browser.
- How to Download JMeter?
-
-
- Have any query or need more information about JMeter? Contact us today at
-
+1 -484-876-1867
-
-
- or
-