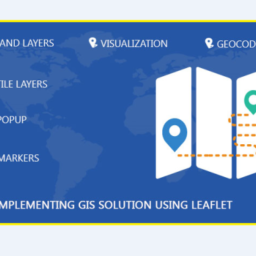
A geographic information system (GIS) is designed to store, retrieve, manage, display, and analyze all types of geographic and spatial data related to the positions on the earth’s surface.
GIS Software Features
- Maps and Layers- It allows user to create an interactive map using their own data.
- Visualization- A user can set font/style/opacity settings for points, lines, areas, labels, legends, and drawings. The drawing items are customizable.
- Geocoding- Flexible pin-mapping tools support geocoding by address, postal code, city/town and coordinate.
Leaflet – Leaflet is the leading open-source JavaScript library for mobile-friendly interactive maps. Here are some Leaflet.js demos. It has almost all online map features you may need.
- Tile layers
- Popup
- Markers
- Vector layers like polylines, polygons, circles or rectangles
Using leaflet for GIS Solutions with google map
Steps:
1. Download leaflet.css and leaflet.js.
2. Download leaflet-google.js.
3. Include leaflet.css and then leaflet.js file in the head section of the document.
4. Add google map API reference to the head section of the document.
5. Put a div element inside the body tag to display map.
<div id=”map”></div>
6. Set height and width of the map div.
#map {
width: 800px;
height:400px;
}
–></style>
7. Create a map object, tell it to live in ‘map’ div and give initial latitude, longitude, zoom values.
8. Add google layer and set the layer option.
map.addLayer(googlelayer);
9. Now let’s add marker to the map
10. Now let’s attach some information to the marker.
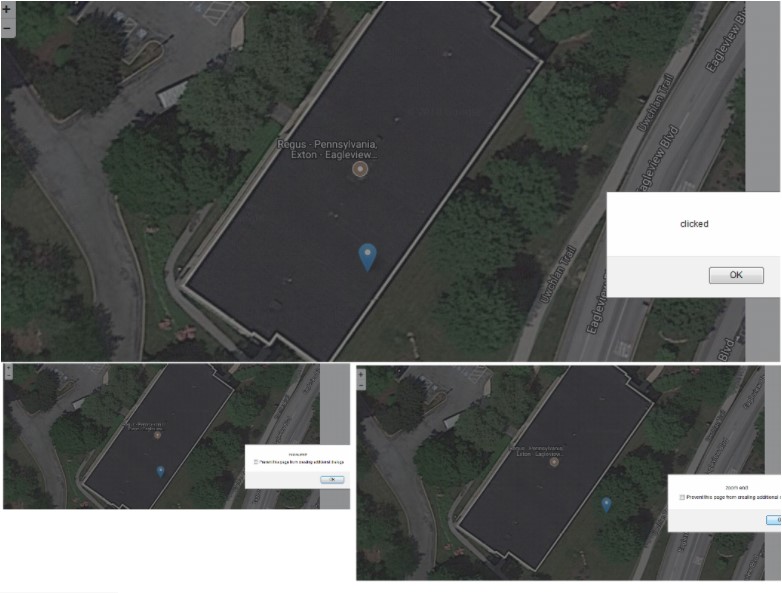
11. Dealing with events- You can control the flow of information on the map using events. Below are some examples
map.on(‘click’, function (e){
alert(“clicked “);
});
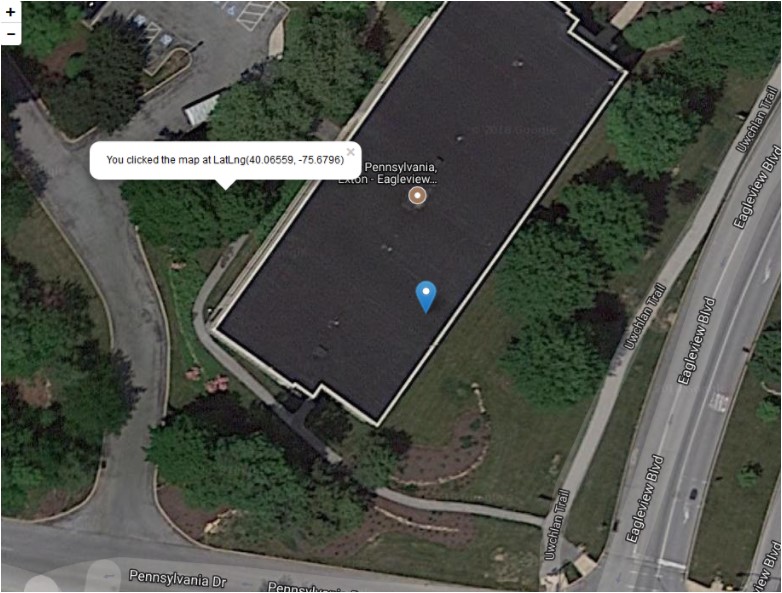
map.on(‘click’, function (e){
var popup = L.popup();
popup
.setLatLng(e.latlng)
.setContent(“You clicked the map at ” + e.latlng.toString())
.openOn(map);
});// zoomend event.
map.on(‘zoomend’, function (e) {
alert(“zoom end “);
});// zoomstart event.
map.on(‘zoomstart’, function (e) {
alert(“zoom start “);
});
Code example:
<!DOCTYPE html><html>
<head>
<title>Leaflet Web Map</title>
<link rel=”stylesheet” href=”http://cdn.leafletjs.com/leaflet-0.7.3/leaflet.css” />
<script src=”http://cdn.leafletjs.com/leaflet-0.7.3/leaflet.js”></script>
<!– set width and height styles for the map –>
<style>
#map {
width: 1020px;
height:760px;
}
</style>
<!–Include google maps api –>
<script src=”http://maps.google.com/maps/api/js?key=Your API Key&sensor=false”></script>
<script src=”leaflet-google.js”></script>
</head>
<body>
<!– place holder for map –>
<div id=”map”></div>
<script>
// create map object, tell it to live in ‘map’ div and give initial latitude, longitude, zoom values
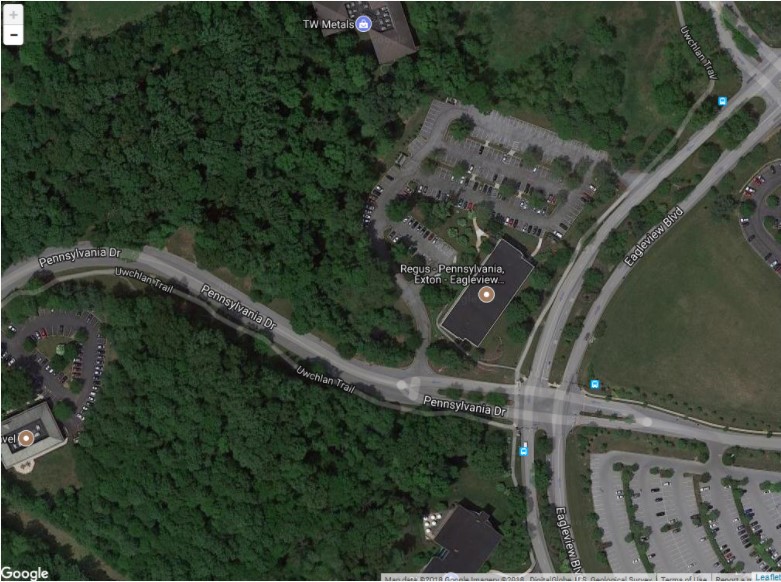
var map = L.map(‘map’).setView([40.0654443, -75.679283], 20);
googlelayer = new L.Google(‘HYBRID’);
map.addLayer(googlelayer);
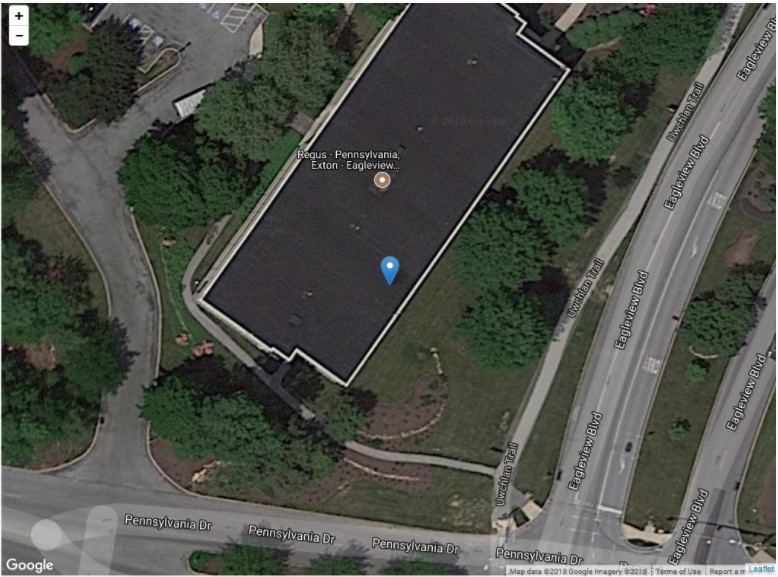
// adding marker
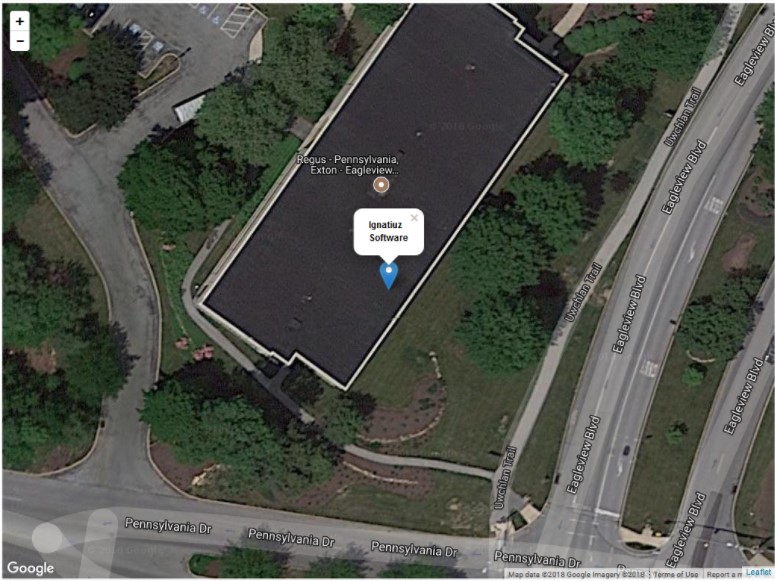
var marker = L.marker([40.0654443, -75.679283]).addTo(map);
marker.bindPopup(“<b>Ignatiuz <br>Software</b>”).openPopup();
// Dealing with map event
// click event.
map.on(‘click’, function (e){
var popup = L.popup();
popup
.setLatLng(e.latlng)
.setContent(“You clicked the map at ” + e.latlng.toString())
.openOn(map);
});
// zoomend event.
map.on(‘zoomend’, function (e) {
alert(“zoom end “);
});
// zoomstart event.
map.on(‘zoomstart’, function (e) {
alert(“zoom start “);
});
</script>
</body>
</html>
Thank you, all the readers will see you in next blog. Till then keep reading.
Have any query or need more information about leaflet for GIS solutions? Contact us today at +1 -484-876-1867 or send us a message.