So my friends this blog is in continuation of my previous blog – Excel VBA working with charts – Part 1
If you haven’t read it follow the link. In part 1 we looked on creating chart sheet in this section we will see about creating embedded charts.
We will use the same data sets which we have used in part 1.
Embedded Chart
Embedded chart are not separate sheet tabs in your workbook. They are embedded in a worksheet. Also embedded charts doesn’t have event handlers
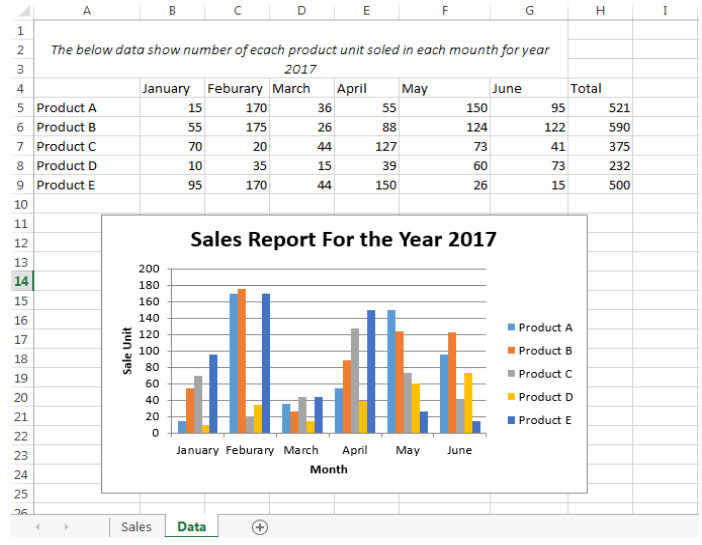
| Sub EmbeddedChartDemo() Dim chtChart As Chart Set ChartDemo = Application.Workbooks(“Chart Demo.xlsm”) Set DataSheet = ChartDemo.Sheets(“Data”) Set chtChart = Charts.Add Set chtChart = chtChart.Location(xlLocationAsObject, name:=“Data”) With chtChart .ChartType = xlColumnClustered .SetSourceData Source:=DataSheet.Range(“A4:G9”), PlotBy:=xlRows .HasTitle = True .ChartTitle.Text = “Sales Report For the Year 2017” .Axes(xlCategory, xlPrimary).HasTitle = True .Axes(xlCategory, xlPrimary).AxisTitle.Characters.Text = “Month” .Axes(xlValue, xlPrimary).HasTitle = True .Axes(xlValue, xlPrimary).AxisTitle.Characters.Text = “Sale Unit” ‘Specify the location of the chart With .Parent .Top = Range(“B11”).Top .Left = Range(“B11”).Left End With End With End Sub |
The above code is almost same as our previous chart sheet code. We will see the difference only.
For details read previous blog – Excel VBA working with charts – Part 1.
This line specify the location of the chart. This will create the chart on Data sheet.
Set chtChart = chtChart.Location(xlLocationAsObject, name:=“Data”)
The syntax is expression . Location( Where , Name )
For creating it on new sheet.
Set chtChart = chtChart.Location(xlLocationAsNewSheet, name:=“DataNew”)
In that case you have to remove below lines as it will be a new sheet. Give it a try and see what happens.
‘Specify the location of the chart
With .Parent
.Top = Range(“B11”).Top
.Left = Range(“B11”).Left
End With
If you are putting chart on the same worksheet the you will need the below line to specify the position of the chart in the specified worksheet and in our case i.e. “Data” worksheet.
‘Specify the location of the chart
With .Parent
.Top = Range(“B11”).Top
.Left = Range(“B11”).Left
End With
Rest of the code remains the same.
In upcoming blog we will see how to work with different chart types.
Thank you, all the readers will see you in next blog. Till then keep reading.
Ignatiuz is having a strong expertise to provide better solution for Learning Management System (LMS) Solution as per the client requirements. To know more about the providing- http://ignatiuz.com/solutions/lms-solutions/
If you have any query or want more information on Excel Automation or Excel VBA Coding , contact us today at +1-484-876-1867 or send us a message.